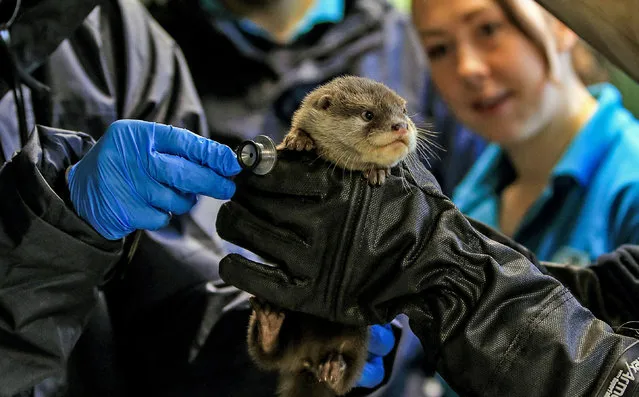
A baby otter has its first health checkup at Chester zoo, England on May 2, 2018. It was among five pups being weighed and microchipped. (Photo by Peter Byrne/PA Wire)
(2nd from R) Miss Georgia Betty Cantrell reacts to advancing, en route to victory, at the Miss America Pageant at Boardwalk Hall, in Atlantic City, New Jersey, September 13, 2015. (Photo by Mark Makela/Reuters)
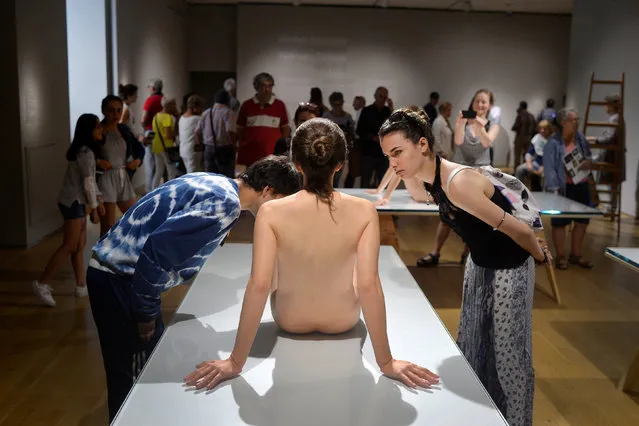
Visitors observe the sculpture “That Girl” by U.S. artist Paul McCarthy, at the Hyperrealist Sculpture 1973-2016 exhibition in the Museum of Bellas Artes in Bilbao, northern Spain, July 27, 2016. (Photo by Vincent West/Reuters)
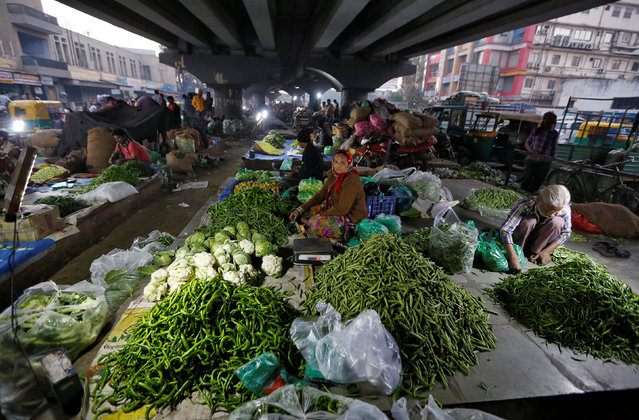
Vendors selling vegetables wait for customers under a flyover in the early morning in Ahmedabad, India on February 1, 2017. (Photo by Amit Dave/Reuters)
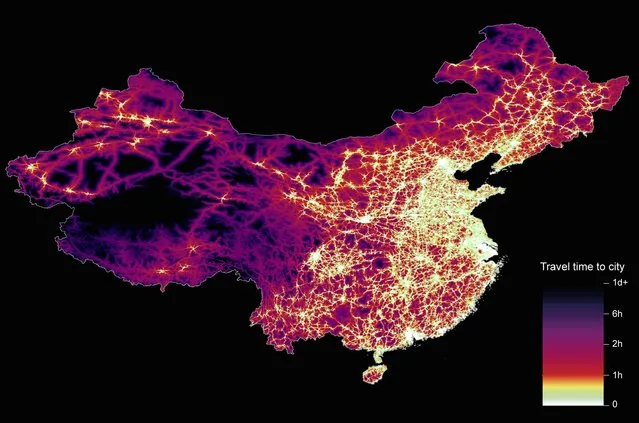
From Britain to China to Mali, new maps showing travel times to the nearest urban centre reveal huge differences between countries. Using Open Street Map and Google, a University of Oxford team have created a visual breakdown that suggests major inequalities when it comes to commuting. Here: China. The dataset used for China was unique as it relied solely on Open Street Map, due to restrictions on accessing Google data. The population is densely concentrated in the east and accessibility is increased, whereas rural provinces in the west remain remote. (Photo by Daniel Weiss/Jennifer Rozier/Malaria Atlas Project/University of Oxford)