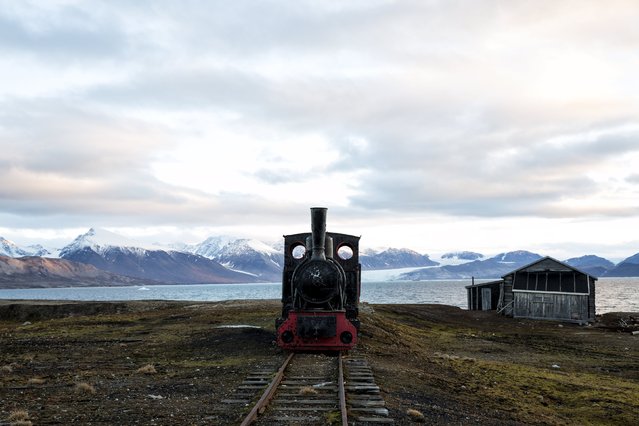
An old locomotive train that was used for transporting coal is preserved as a monument at Ny-Alesund, in Svalbard, Norway, October 11, 2015. A Norwegian chain of islands just 1,200 km (750 miles) from the North Pole is trying to promote new technologies, tourism and scientific research in a shift from high-polluting coal mining that has been a backbone of the remote economy for decades. (Photo by Anna Filipova/Reuters)
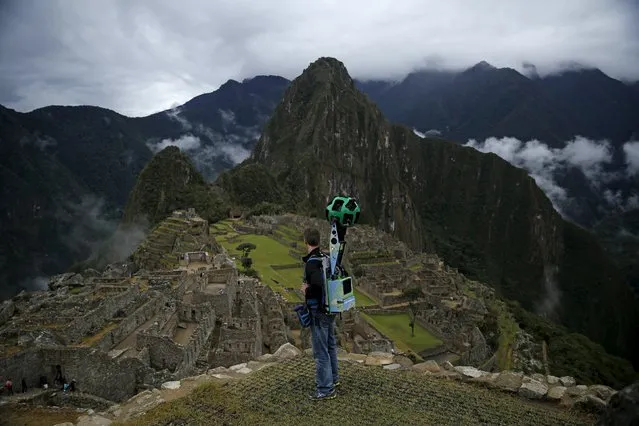
Daniel Filip, Tech Lead Manager for Google Maps, carries the Trekker, a 15-camera device, while mapping the Inca citadel of Machu Picchu for Google Street View in Cuzco, Peru, August 11, 2015. (Photo by Pilar Olivares/Reuters)
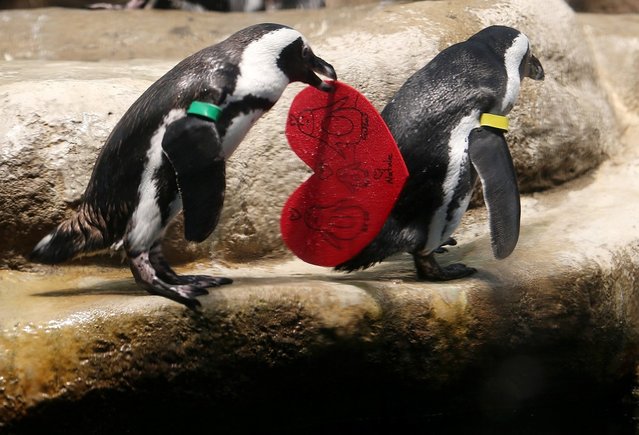
An African Penguin holds a Valentine's Day card at the California Academy of Sciences on February 13, 2013 in San Francisco, California. In honor of Valentine's Day, the colony of African Penguins at the California Academy of Sciences received heart-shaped red valentines with hand written messages from Academy visitors. (Photo by Justin Sullivan)
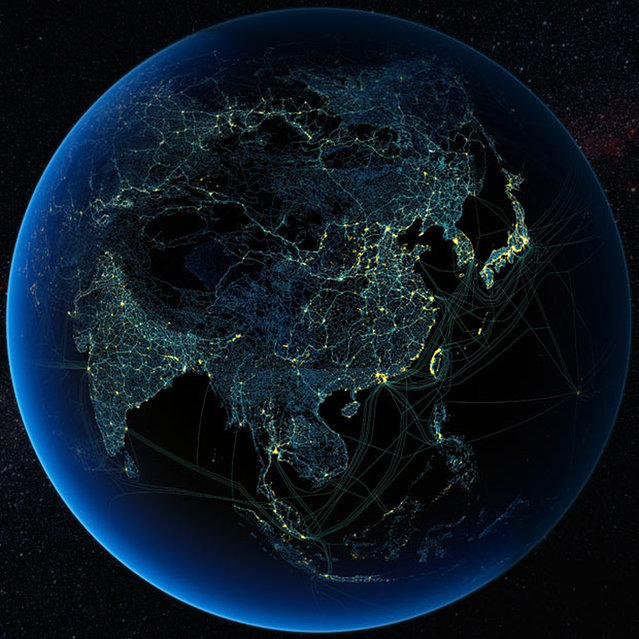
Defined according to wikipedia it is “a recent and informal geologic chronological term that serves to mark the evidence and extent of human activities that have had a significant global impact on the Earth’s ecosystems. The term was coined by ecologist Eugene Stoermer but has been widely popularized by the Nobel Prize-winning atmospheric chemist Paul Crutzen.”
The images here where created by Felix Pharand-Deschenes depicting how various human influences, from road and rail, to internet cables and airlines create significant patterns covering the Earth. What can we learn from these patterns in how they are influencing the environment
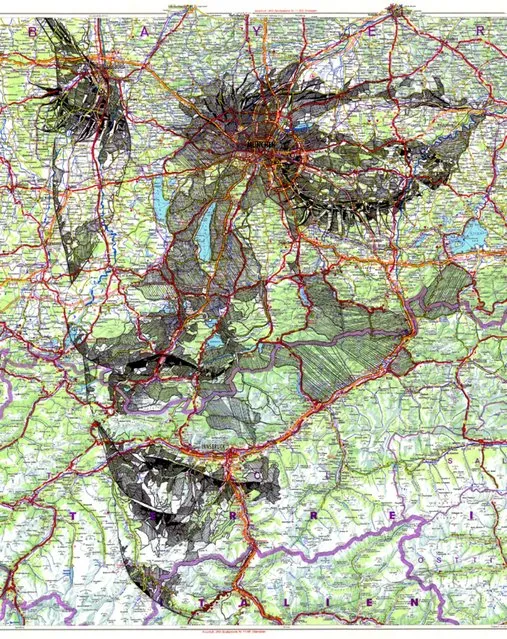
A talented artist has created breathtaking intimate portraits by using detailed maps of the world as his canvas. Cardiff-based illustrator, Ed Fairburn, combines the patchwork of roads, terrains and rivers to for his unique sketches. Photo: Ink on a 1977 road map of Germany. (Photo by Ed Fairburn/Rex Features)
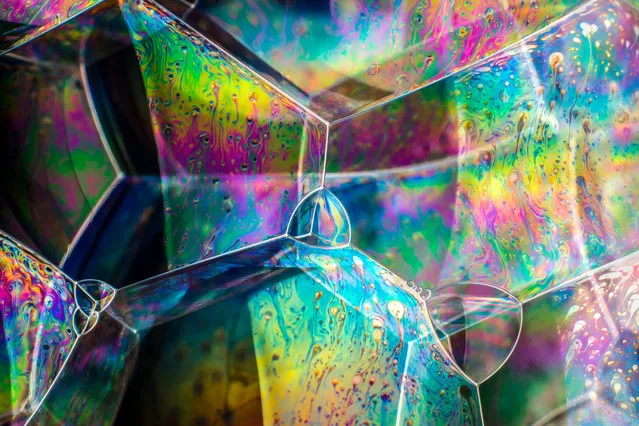
Soap Bubble Structures by Kym Cox. Bubbles optimise space and minimise their surface area for a given volume of air. This phenomenon makes them a useful tool in many areas of research, in particular, materials science and “packing” – how things fit together. Bubble walls drain under gravity, thin at the top, thick at the bottom, which interferes with travelling lightwaves to create bands of colour. Black spots show the wall is too thin for interference colours, indicating the bubble is about to burst. (Photo by Kym Cox/2019 Science Photographer of the Year/RPS)